Building Interactive Stock Data Analytics Dashboards with Streamlit

Talks about artificial intelligence, building SaaS solutions, product management, personal finance, freelancing, business, system design, programming and tech career tips
🔱 Introduction
Nowadays for several professionals across the board, capital investment is an integral part of their wealth management and future planning. Whenever, one steps into this sphere of life and starts understanding the fundamentals, a limitation for a novice would be access to a custom trading analysis tool beyond the standard features offered by exchanges. So often one might progress in developing their strategies for investment as they surge ahead in their learning path but backtesting them maybe a hurdle.
In this blog, I am going to illustrate how one can build a stock data analytics dashboard with Python using an open-source framework called streamlit.
📌 NOTE:
This tutorial is purely intended for educational purposes and should not be considered as financial advice for investment in equity market or elsewhere.
🔱 Basics of stock data
Without diving into the techincal definition, we can understand that stock as a part of company's equity. If someone claim's they have 50000 stocks for a company which has 100000 stocks, it loosely implies that they own 50% of the company.
Now, you might be wondering why does the company want random people to have partial ownership in their firm? Well, the answer is to grow financially and procuring investments. Whenever one acquires the stock of a company, you tend to pay a price for that which the company can use for it's operations or any work (This might sound similar to a bond but the detailed analysis and differences would be covered in a future blog).
Moving on, these stocks need to be bought from a particular place which can be trusted by everyone and regulated for potential frauds. This platform is called the stock exchange. In the US, the most popular one is the NYSE (New York Stock Exchange) while in India two of the most popular ones are BSE(Bombay Stock Exchange) and NSE(National Stock Exchange)
The price of a stock is volatile. Several people are trying to buy and sell it and like any other commodity you would observe in your life for which there are two continous waves of supply and demand, the price tends to flutuate.
Typically, the act of buying or selling of stocks (at times referred to as trading) is permitted within some hours of the day. For NYSE, it's from 9:30 am EDT to 3:30pm EDT. The price of the stock when the market opens (i.e. the time from which we are allowed to trade) is called Open Price while the price at the market close (i.e the time after which we are not allowed to trade) is called Close Price. During the trading window of the day (the time I mentioned above), the highest price that the stock hits is called High while the lowest price it drops to is called Low.
📌_NOTE_:
The Open, Close, High and Low may or may not be same
The Close of a day and the Open of the following day may or may not be the same (There is a interesting reason for that which I would request you to explore by yourself!)
The concepts of Open, High, Low, Close can be extended to intervals of 1 hour, 5 min, 1 min or even a week. But for this analysis we would simply go ahead with the 1Day interval (i.e for entire trading window in a day)
For our purpose, we would be directly obtaining the stock price data from the NYSE using an API call.
🔱 Now, what's streamlit?
Well, streamlit is a python package that let's one build end-to-end applications natively with python without having to get involved with front end development. Furthermore, we can use it to build highly customizable and interactive dashboards using the functions we already built while doing the analysis on our IDE or Jupyter Notebook.
In case you are not well versed with Python, don't worry most of the commands are as simple as you would write in plain English.
🔱 Installing Streamlit
Open your terminal
Create a new virtual environment and activate it [OPTIONAL]
Get the package
pip install streamlit
📌 NOTE:
We would be needing some more packages for the pupose of our data analysis -
pip install numpy matplotlib pandas pandas_datareaderpandas: Used for handling structured data in a dataframe
numpy: Used for numerical computations and array computing
matplotlib: Used for plotting
pandas_datareader: Used to fetch our stock data (in our case)
🔱 Starting off
- Move to your preferred working directory, create a new sub-directory and open it.
cd projects
mkdir PyFinAnalysis
cd PyFinAnalysis
- Create a new python file. I would prefer to call it app.py
touch app.py
- Now, open your favourite IDE. I personally prefer VSCode
code .
- Let's import our libraries
from datetime import datetime

import matplotlib.pyplot as plt
import numpy as np
import pandas as pd
import pandas_datareader as pdr
import streamlit as st
📌 NOTE:
datetime: used to handle objects related to dates and time
import mr_john_doe as ci: While importing libraries in Python, we tend to abbreviate them as per convinience or community set standards so that it is easy to invoke their functions later on. Imagine if Mr.John Doe is your Class Incharge and you have to write several reports about his work. Instead of using his name every time, you can refer to him as the CI which is something everyone concerned in the class would understand easily.
- Defining the main function
def main():
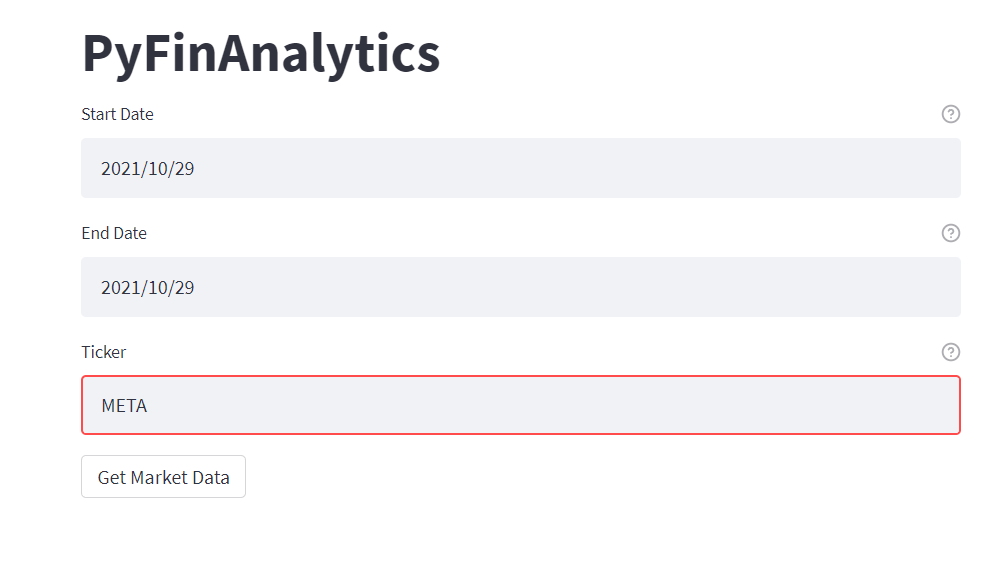
st.title("PyFinAnalytics)
if __name__ == main():
main()
We define the heart of the codebase of our dashboard within the main function and set it to be the first method to be invoked when the script is executed by the Python interpreter.
The function
st.titleprints out the title of the app as per the string passed as a parameter to it.To see the output, open the terminal (making sure you are still in the same location)
streamlit run app.pyYour browser will open and redirect to a port on your localhost ( 8501 or 80). You should be able to see something like this 👇🏼
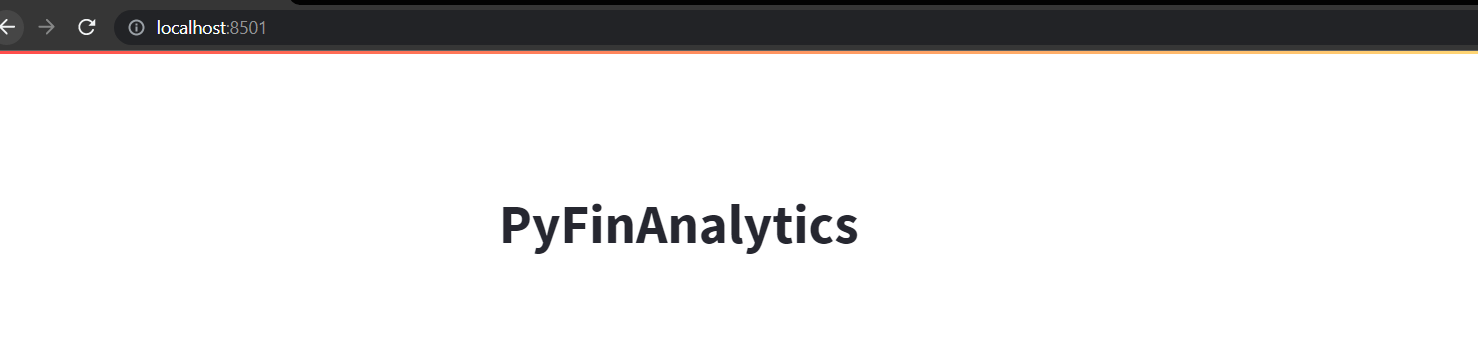
- Congratulations🥳🥳 you have built your first streamlit app!
🔱 Diving into the components one function at a time!
Getting the stock data
Let's define a function fetch_stock_data( ) which takes start date, end date and a ticker as input and returns a dataframe for the daily price movement of the stock uniquely indentified by that symbol, within the given timeframe (both dates being inclusive)
We use the pandas-datareader library to fetch the stock data from the Yahoo Finance website.
def fetch_stock_data(ticker, start_date, end_date):
    """
    Fetch stock data from Yahoo Finance
    """
    stock_data = pdr.get_data_yahoo(ticker, start_date, end_date)
    return stock_data
📌 NOTE:
- I could have done the above operation directly inside the main function but my objective here is to show you how you can use modular components of your previous code to build a dashboard.
Now, for the app to be interactive we would like the data to be entered by the user in real time. For achieving this, let's define input sections using streamlit
For getting the date, we would be using the
st.date_input()function inside the main method and passing the label (i.e. the identifying text for the field), the range of dates which we want the user to select from and an extended help message.We would do this for both the start and end dates.
Since the start date cannot be after end date, it would be obvious for us to restrict the use from chosing an end date before the selected start date.
start_date = st.date_input(
        label = "Start Date",
        min_value=datetime(2000, 1, 1),
        max_value=datetime.today(),
        help="Enter the date from which you want to analyse the stock data",
    )
end_date = st.date_input(
        label = "End Date",
        min_value=start_date,
        max_value=datetime.today(),
        help="Enter the date till which you want to analyse the stock data",
    )
📌_NOTE_:
A datetime object is defined in the format of YYYY-MM-DD or YYYY-MM-DD-HH-MM-SS
datetime.today( ) gives the date for the current date in real time using system clock
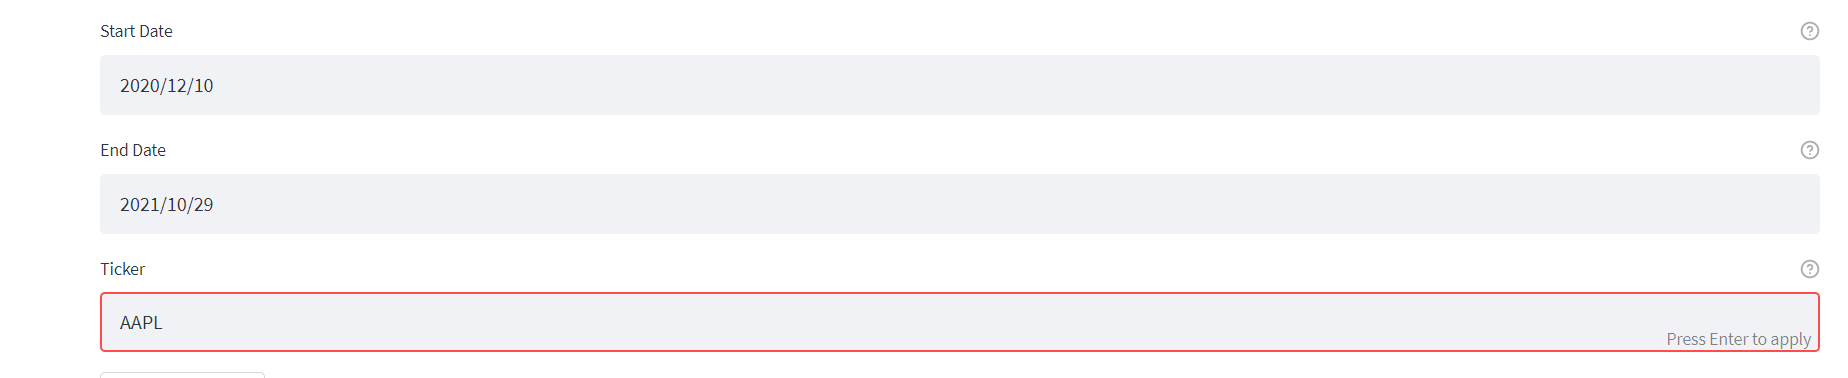
- You would be able to see something like this on your app on the local host.
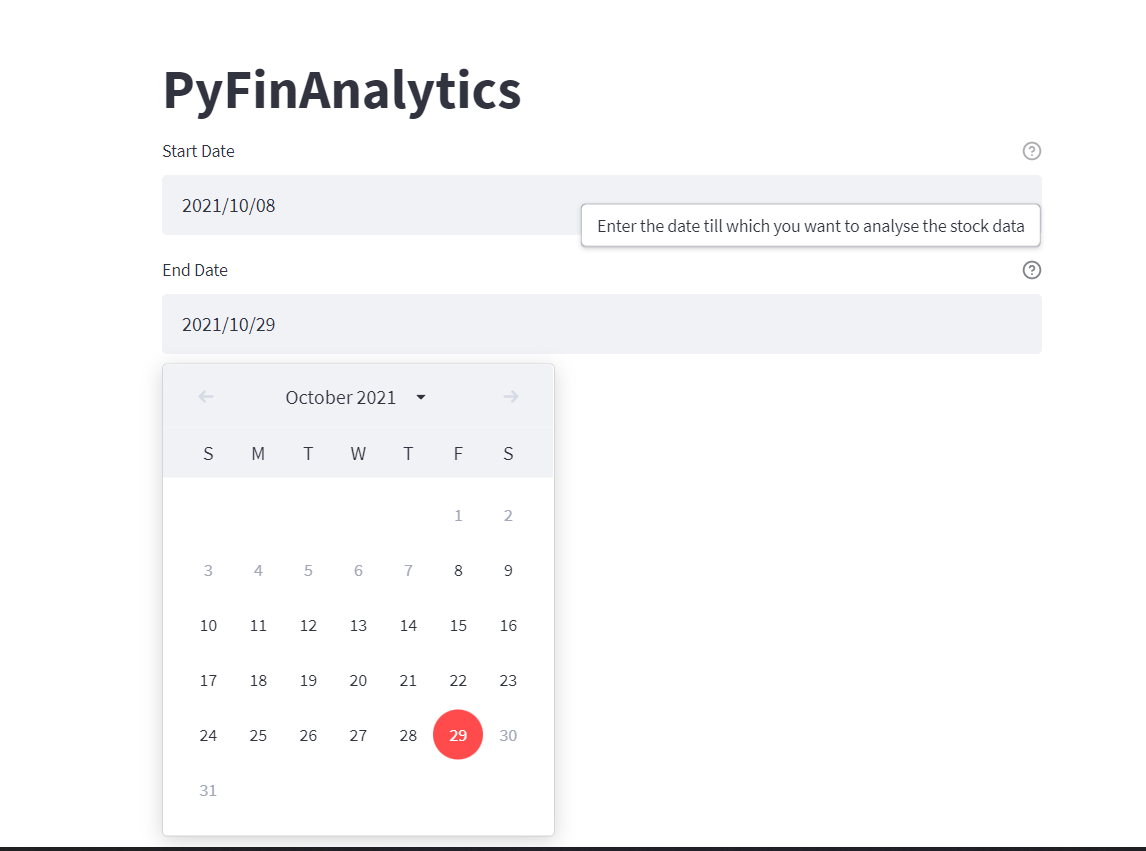
👀Notice that the app does not let me choose a date before 8th October 2021 as my end date since it is my start date. Furthermore, all dates after 29th October 2021 (the day I am writing this blog) are also blocked. On hovering over the ❔ button on the left one can see that the help text pops up.
- Moving ahead, we need the ticker symbol which is basically an unique string to identify a stock listed on a particular market. We use the
st.text_input( )function to create an input textbox for this purpose. The parameters are similar to the one used in the last function except for any limit on the input.
ticker = st.text_input(
        label="Ticker",
        help="Enter the symbol used to uniquely identify publicly traded shares of your company of interest on the stock market",
    )
- The output would be like this 👇🏼
- Let's use the values obtained from user input to call the
fetch_stock_data( )function we defined earlier and store the obtained dataframe in a variablestock_data
stock_data = fetch_stock_data(ticker, start_date, end_date)
- In production,there might be scenarios where the user might enter an invalid ticker symbol for which the API call would fail and we would get an error on our dashboad. To tackle this, we use a try-except (similar to try-catch) block
try:
  stock_data = fetch_stock_data(ticker, start_date, end_date)
except:
   st.error("Oops😅! You have chosen an invalid ticker")
The
st.error( ) functiontends to print the Error Message inside the text box with red background color symbolizing something went wrong and needs to rectifiedLastly, we create a button using
st.button( )function so that after the user has decided the input values they need for the analysis they can order our dashboard to fetch the data instead of it happening as soon as they enter the data.
 if st.button("Get Market Data"):
        try:
            stock_data = fetch_stock_data(ticker, start_date, end_date)
        except:
            st.error("Oops😅! You have chosen an invalid ticker")
- The interaction with the button returns a boolean value (by default it is False when not Pressed) which is fed to a conditional statement to decide whether or not to fetch the data and perform follow-up analysis operations.
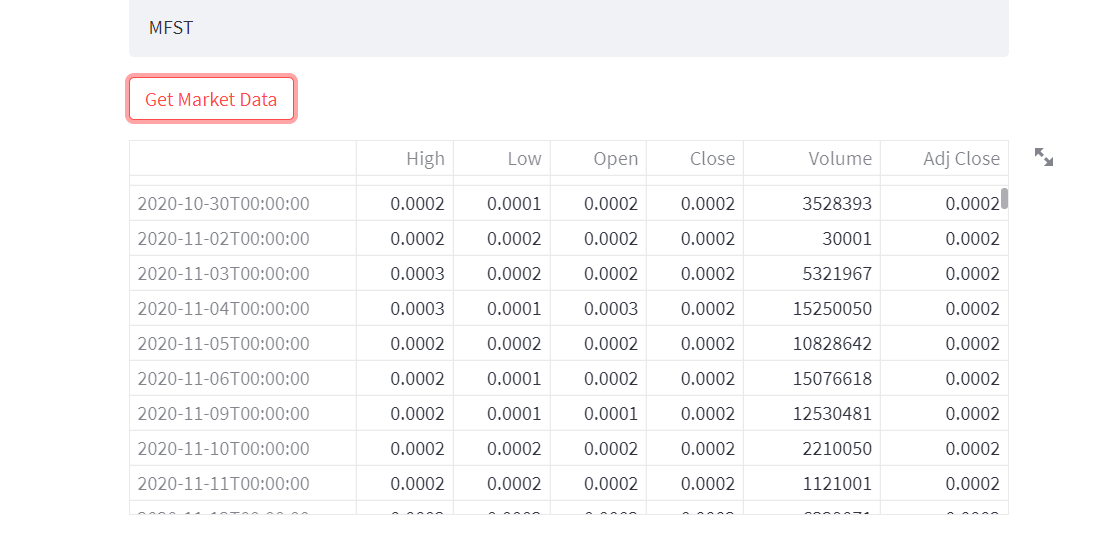
🔱 Displaying the data
In streamlit using st.write( ) function we can render several types of data from text to markdown to dataframes. It serves like one shoe fits all. However, for making use of streamlit's full potential, it is better if we use dedicated functions for output formatting of each datatype.
if st.button("Get Market Data"):
     try:
          stock_data = fetch_stock_data(ticker, start_date, end_date)
          # Display the stock data
          st.dataframe(stock_data)
     except:
          st.error("Oops😅! You have chosen an invalid ticker")
- The
st.dataframe( )assists us to build an interactive component around the dataframe so that the user can scroll throw through the rows and columns of the dataframe without it being spread over the entire page.
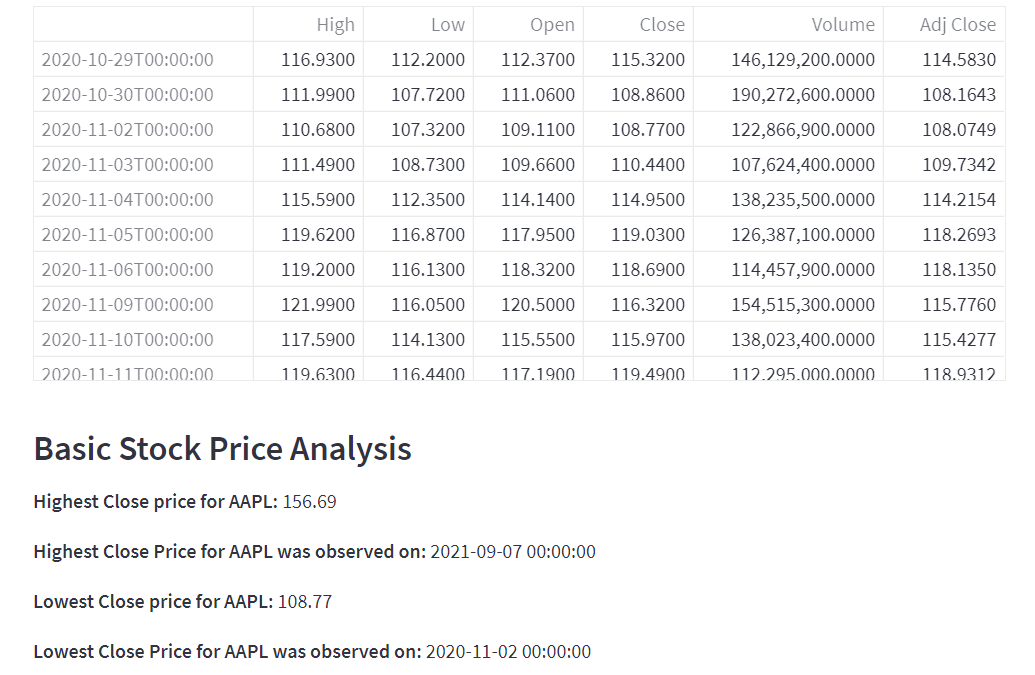
🔱Closing Price Analysis
Now, we can use the Close column (or techincally referred to as series in pandas) to obtain the following:
- What was the highest closing price?
max_closing_price = stock_data["Close"].max()
st.markdown(f"__Highest Close Price for {ticker}__: {round(max_closing_price,4)}")
- When was the highest price observed?
max_date = stock_data[stock_data["Close"] == max_closing_price].index[0]
st.markdown(f"__Highest Close Price for {ticker} was observed on__: {max_date}")
- What was the lowest closing price?
min_closing_price = stock_data["Close"].min()
st.markdown(f"__Lowest Close Price for {ticker}__: {round(min_closing_price,4)}")
- When was the lowest price observed?
min_date = stock_data[stock_data["Close"] == min_closing_price].index[0]
st.markdown(f"__Lowest Close Price for {ticker} was observed on:__: {min_date}")
- The
st.markdown( )function renders the input text as if it was in markdown syntax. For example, for bolden a text we enclose it between double stars or underscores and to italisize it we enclose it between single stars or underscores . We can also print out numbered lists, unumbered lists, headings, underlined texts and links by passing the appropriate markdown syntax to this function.
📌_NOTE_:
- All the prices are rounded upto four decimal places
- Now, let's build a function for this analysis and call it inside the main method
def close_price_analysis(stock_data, ticker):

     # What was the highest closing price for the stock?
    max_closing_price = stock_data["Close"].max()
    st.markdown(f"__Highest Close price for {ticker}:__ {round(max_closing_price,4)}")

    # When was the highest closing price for the stock observed?
    max_date = stock_data[stock_data["Close"] == max_closing_price].index[0]
    st.markdown(f"__Highest Close Price for {ticker} was observed on:__ {max_date}")

    # What was the lowest closing price for the stock?
    min_closing_price = stock_data["Close"].min()
    st.markdown(f"__Lowest Close price for {ticker}:__ {round(min_closing_price,4)}")

    # When was the lowest closing price for the stock observed?
    min_date = stock_data[stock_data["Close"] == min_closing_price].index[0]
    st.markdown(f"__Lowest Close Price for {ticker} was observed on:__ {min_date}")
- We will call this function inside our main function right after we displayed the data.
# Basic closing price analysis
st.markdown(" ")
st.markdown("### Basic Stock Price Analysis")
close_price_analysis(stock_data, ticker)
📌_NOTE_:
👀Notice that we have intentionally left an empty line after the previous element to make it visually appealing.
Furthermore, we have a subheading for the analysis we are performing.
And finally the appropriate function is called by passing the dataframe and other necessary parameters (In this case the ticker)
This is a pattern we would be following for all the components in our dashboard
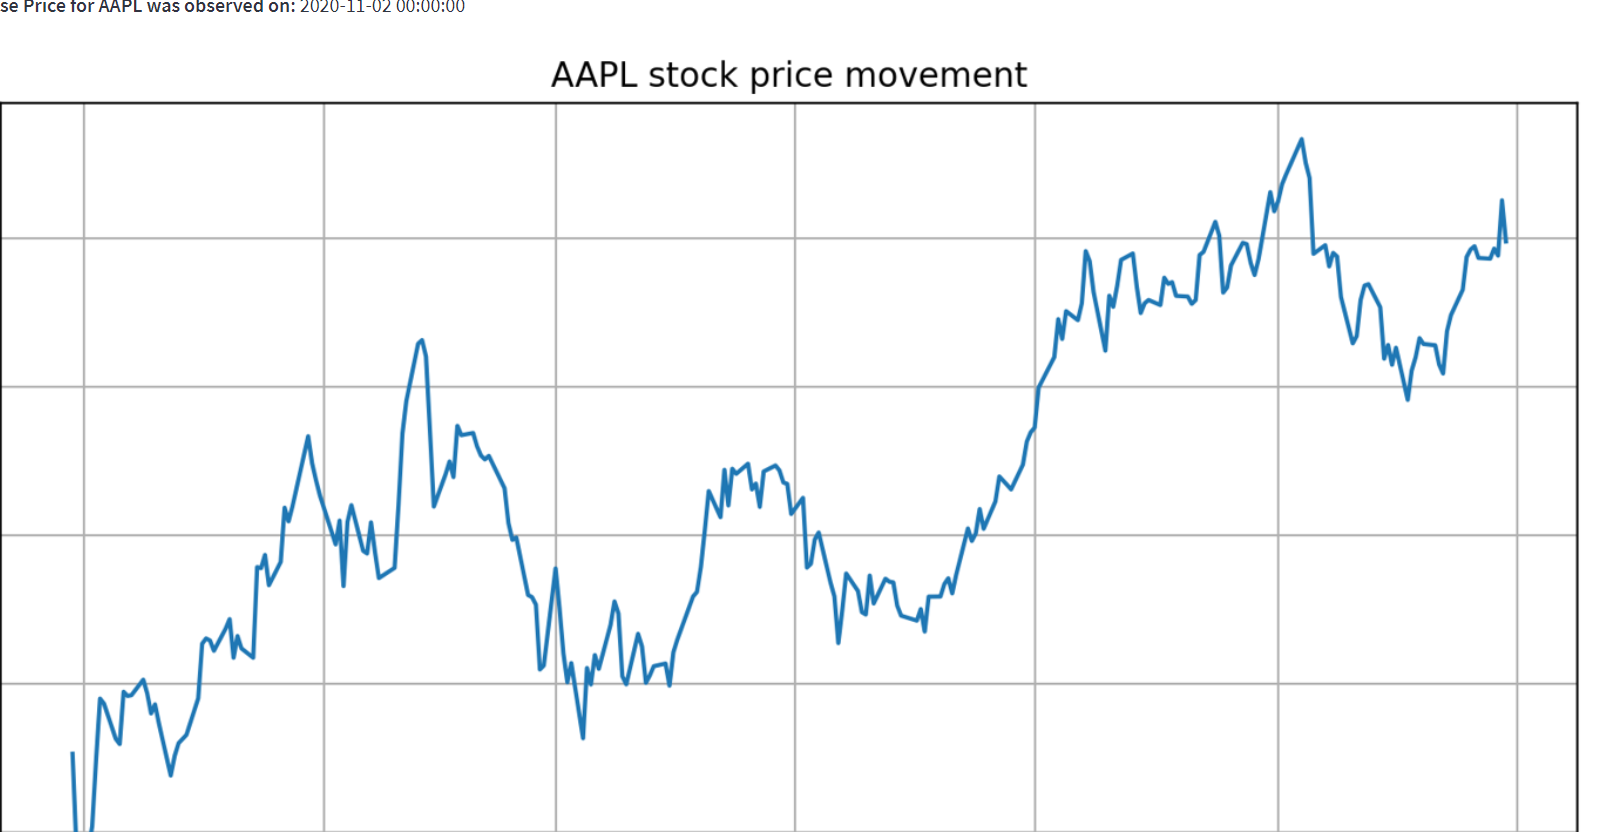
🔱 Plotting the Close Price Movement
def plot_close_price(stock_data, ticker):
    """
    Method to plot the movement of close price of the stock
    """
    fig, ax = plt.subplots(figsize=(10, 5))
    ax = fig.add_subplot(111)
    ax.plot(stock_data["Close"])
    ax.set_title(f"{ticker} stock price movement")
    ax.set_xlabel("Date")
    ax.grid(True)
    st.pyplot(fig)
The string right after the function name is called docstring. It is used to make functions more understandble for developers who would use this code in the future.
We define a figure object using
matplotlib.pyplotwhich is of size 10 by 5 pixelsTypically a figure may contain mutiple plots called as subplots which can be accessed by ( row_no, column_no, fig_no).
A scatter plot is drawn using the datapoints from the
stock_data["Close"]series.The Titles, axes labels and grid are set with
ax.set_title( ),ax.set_xlable( ),ax.set_ylable( )andax.grid( )methods.Streamlit's wrapper over matplotlib's native function `st.pyplot( )' is used to display the figure.
Similar to the previous part, we have to call this method in the main function.
# Close price movement
st.markdown(" ")
st.markdown("### Stock Price Movement")
plot_close_price(stock_data, ticker)